Gallery
Browse our collection of custom dashboards and data visualizations
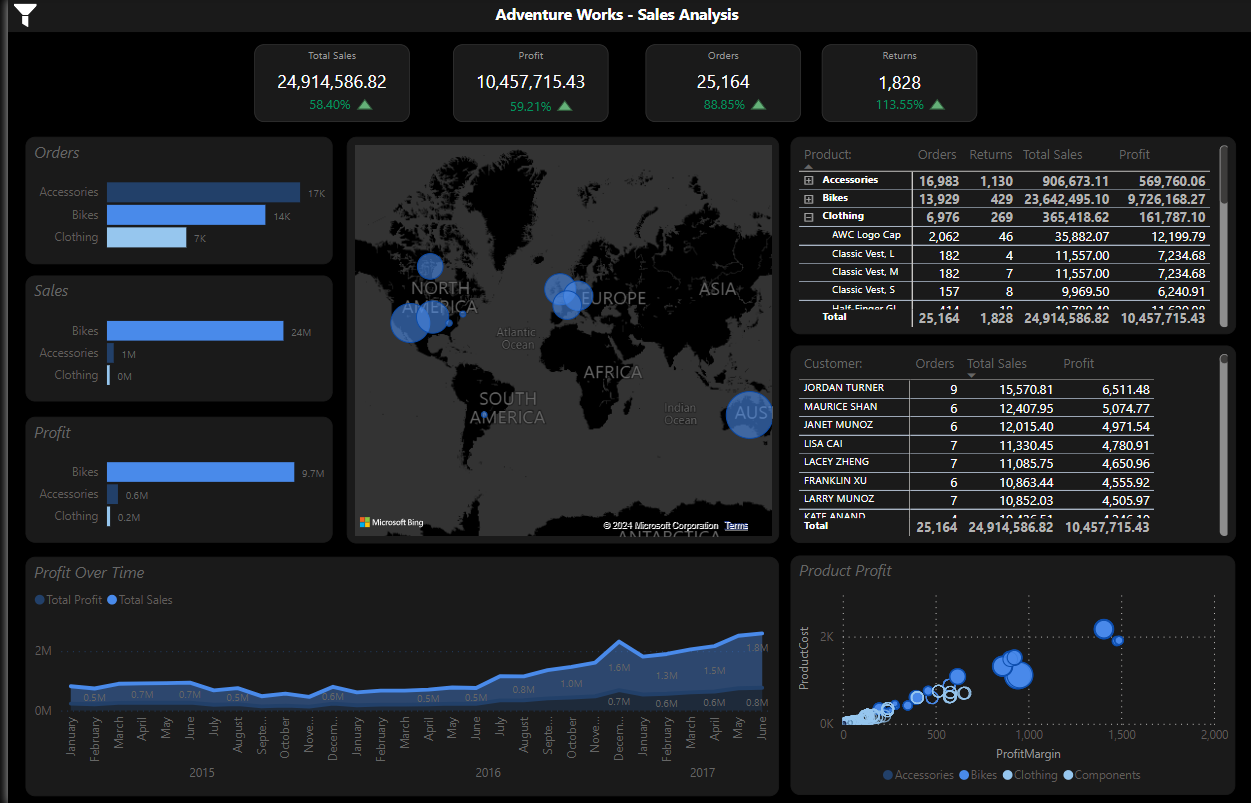
Adventure Works
Interactive dashboard showing sales performance across regions
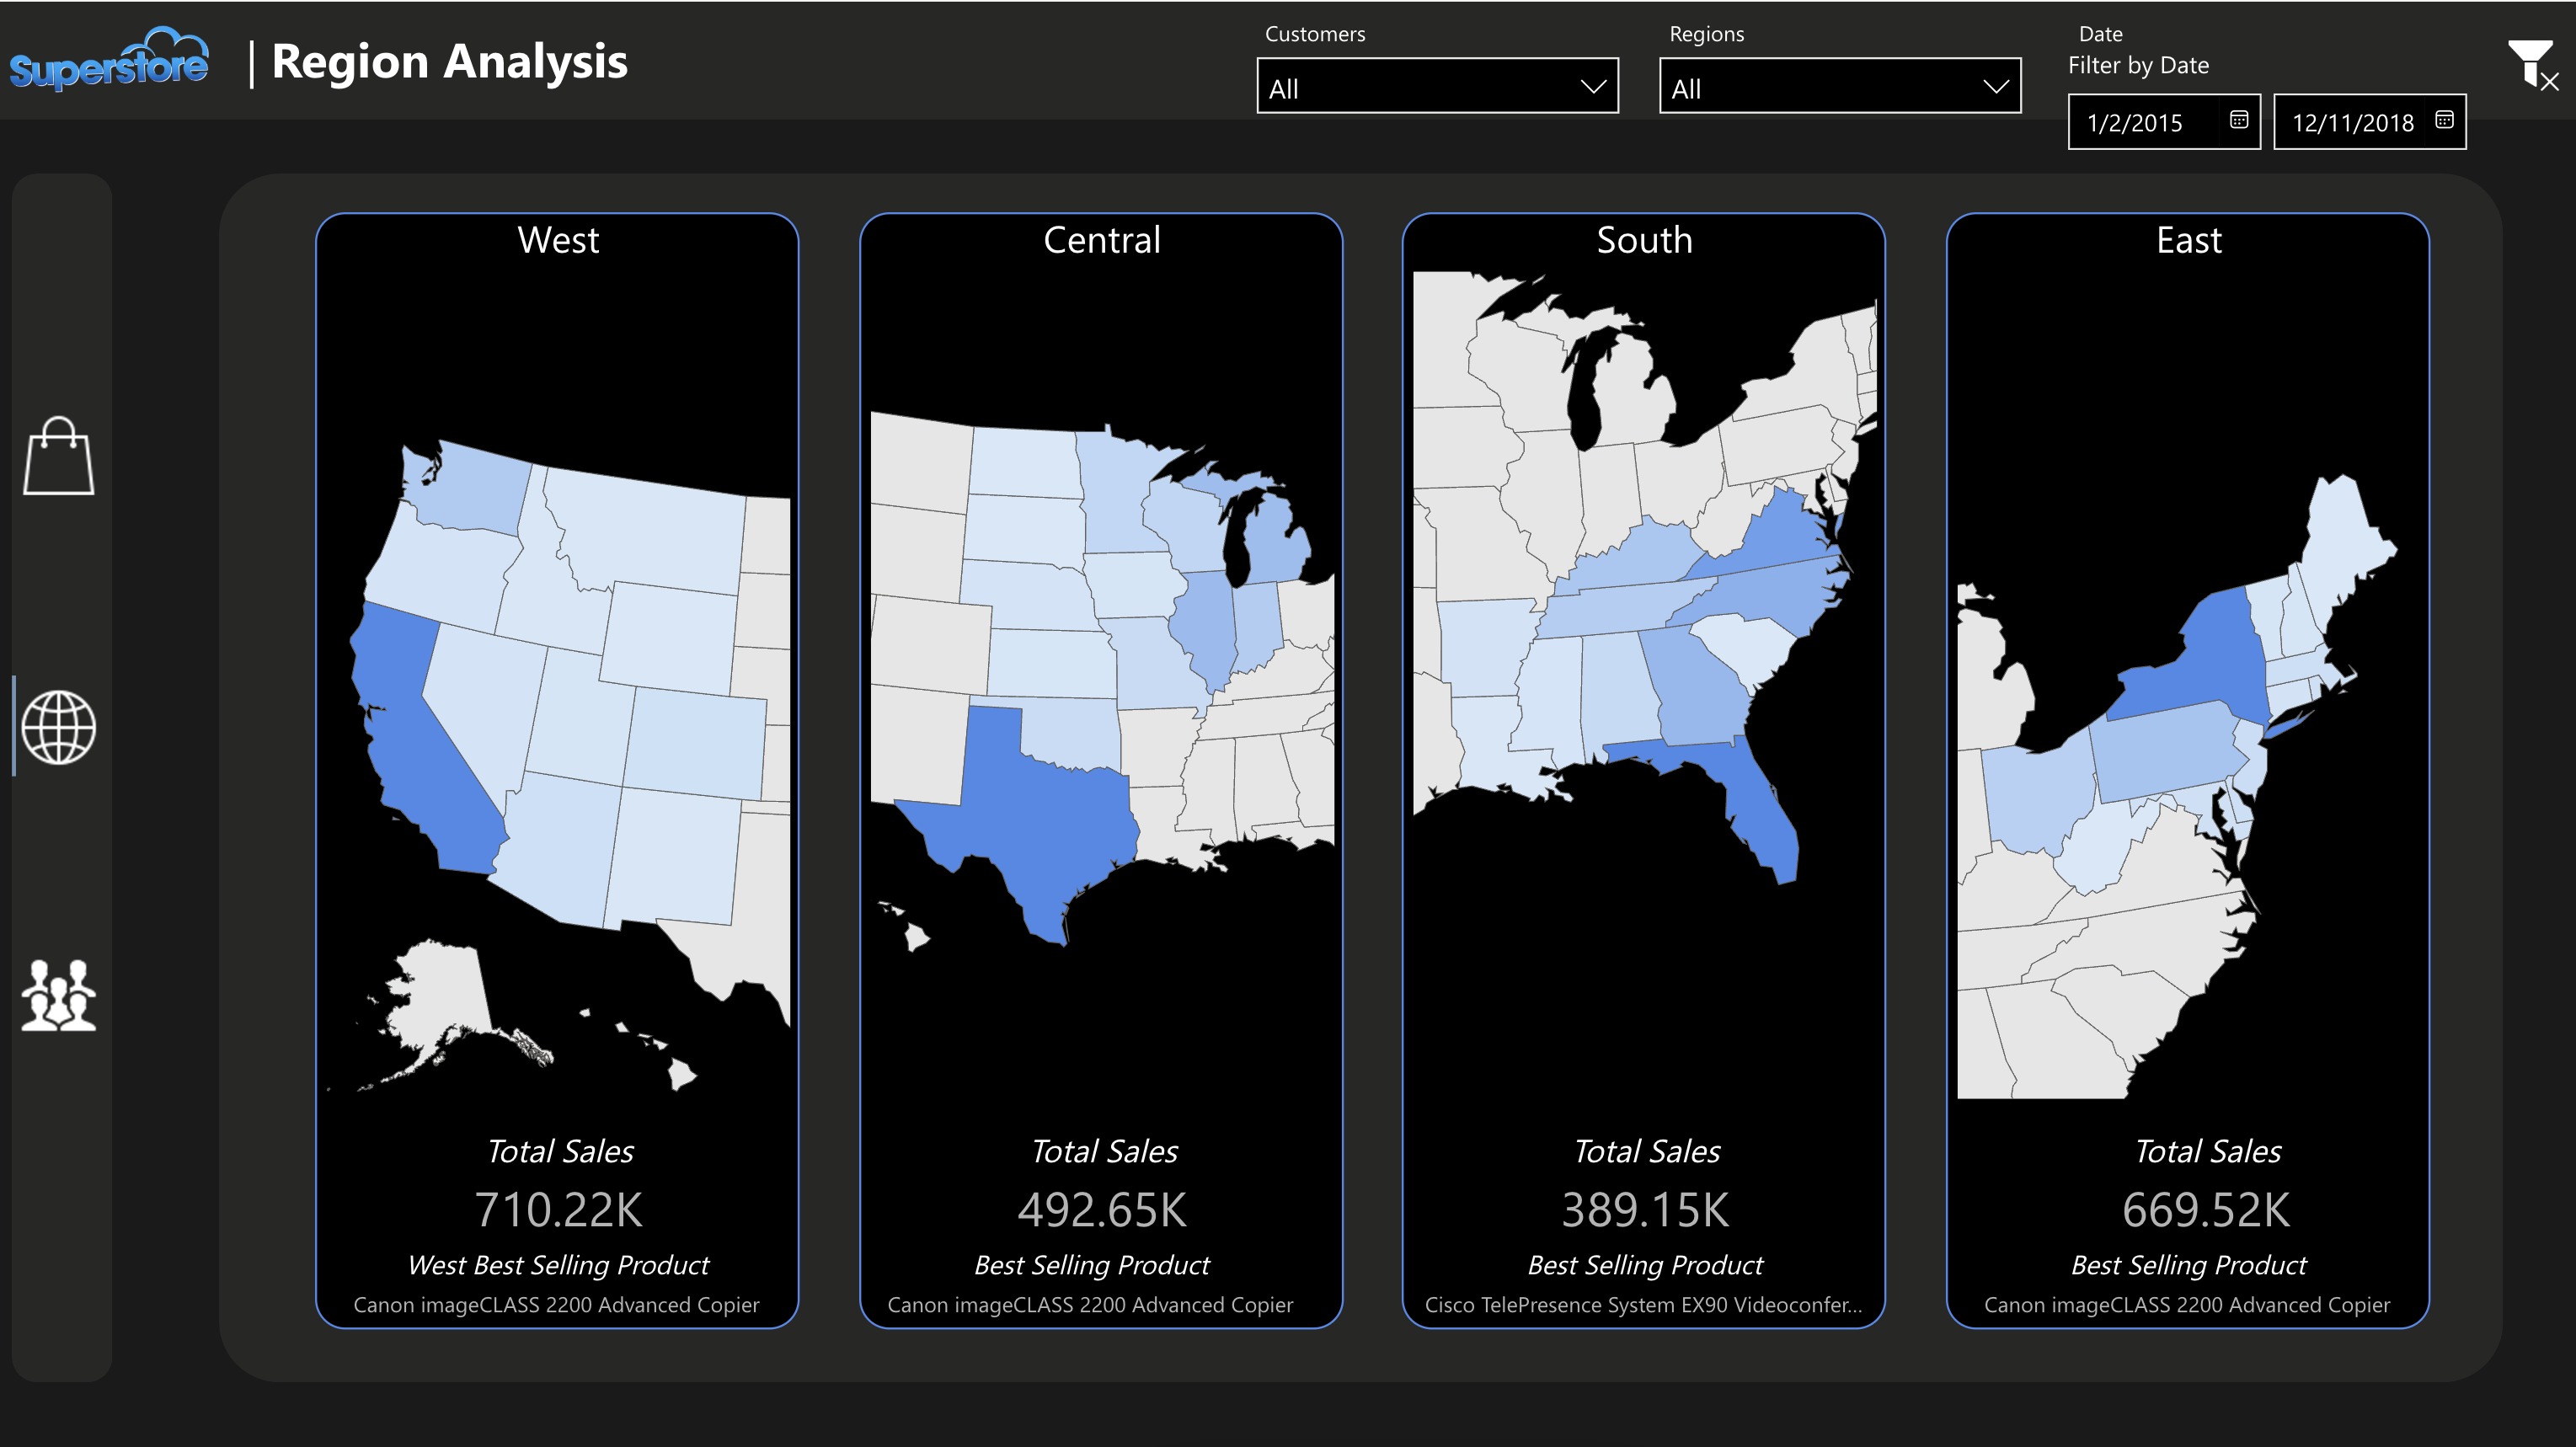
Superstore Analysis
Comprehensive analysis of sales, profits, and customer behavior for Superstore retail data, providing insights into regional performance and product categories.
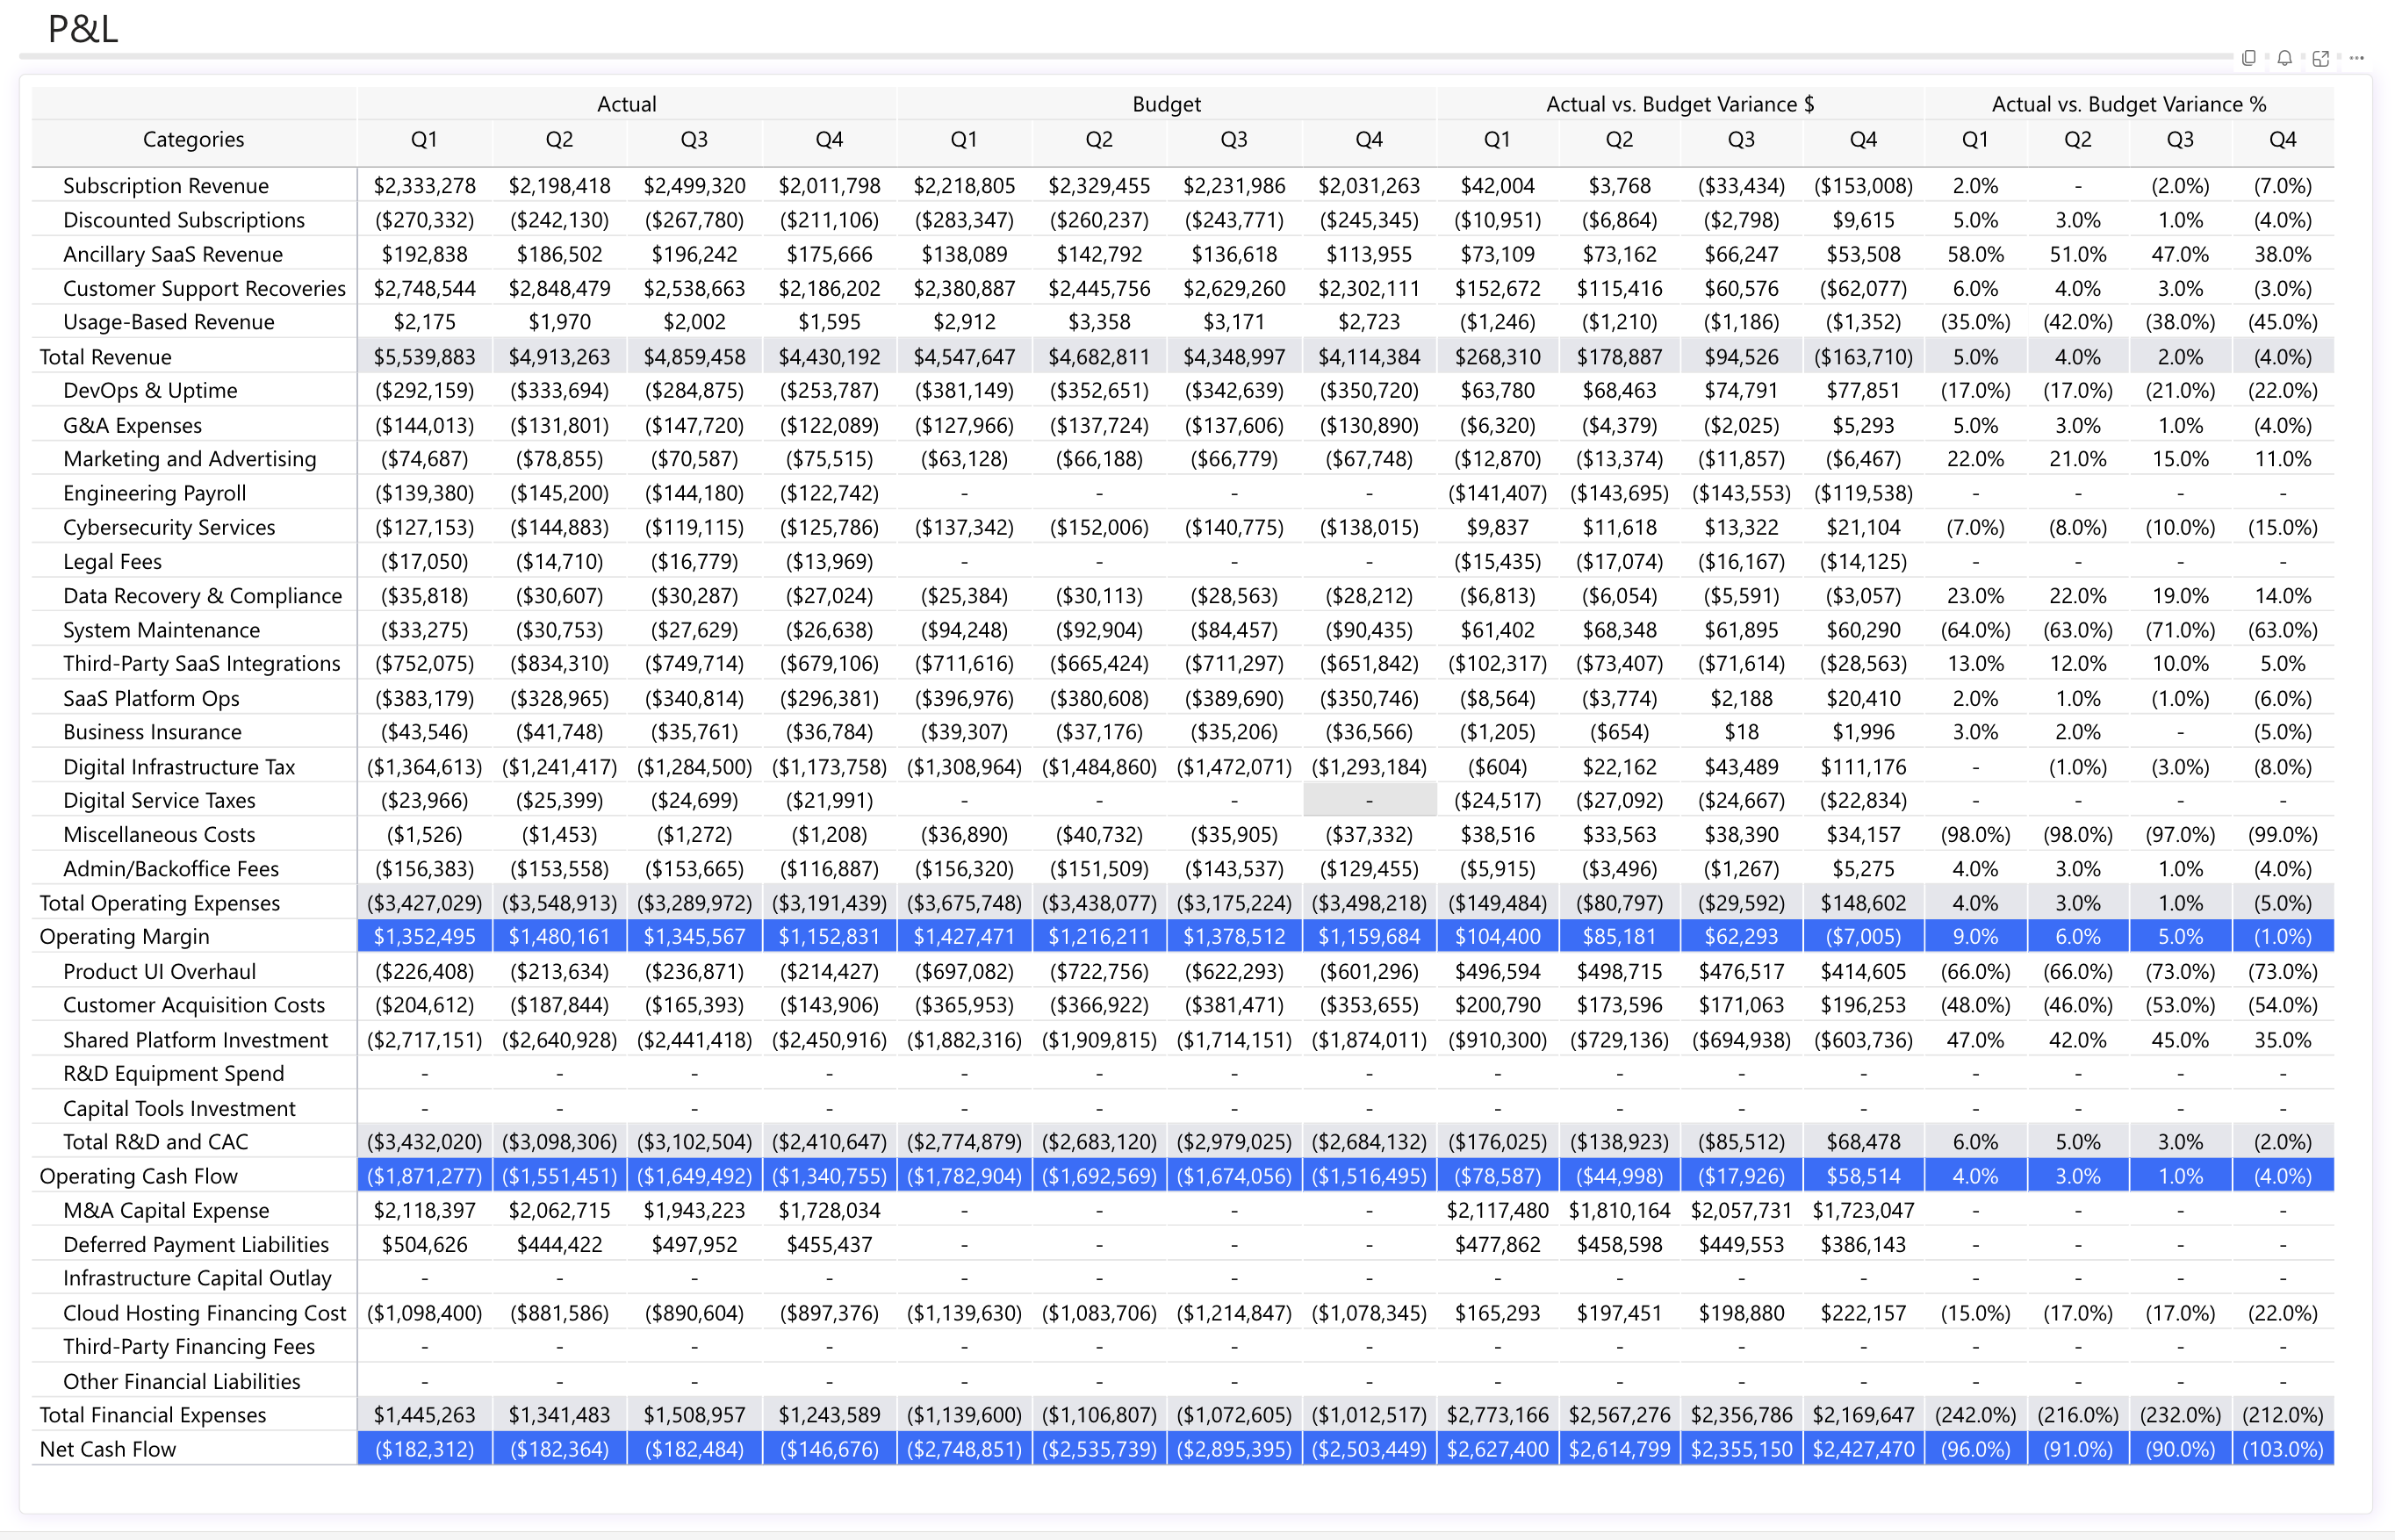
Automated Profit and Loss Statement
Comprehensive automated P&L statement dashboard providing real-time financial insights, revenue breakdowns, and profitability analysis for business performance monitoring.
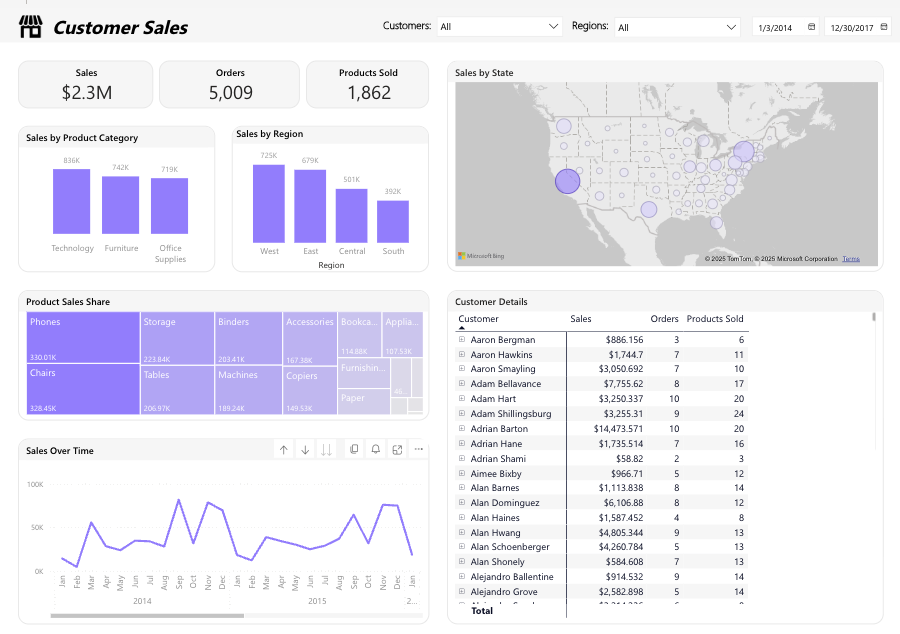
Customer Sales Report
Interactive Power BI dashboard displaying comprehensive customer sales analytics with sales performance, order tracking, product insights, and regional analysis.
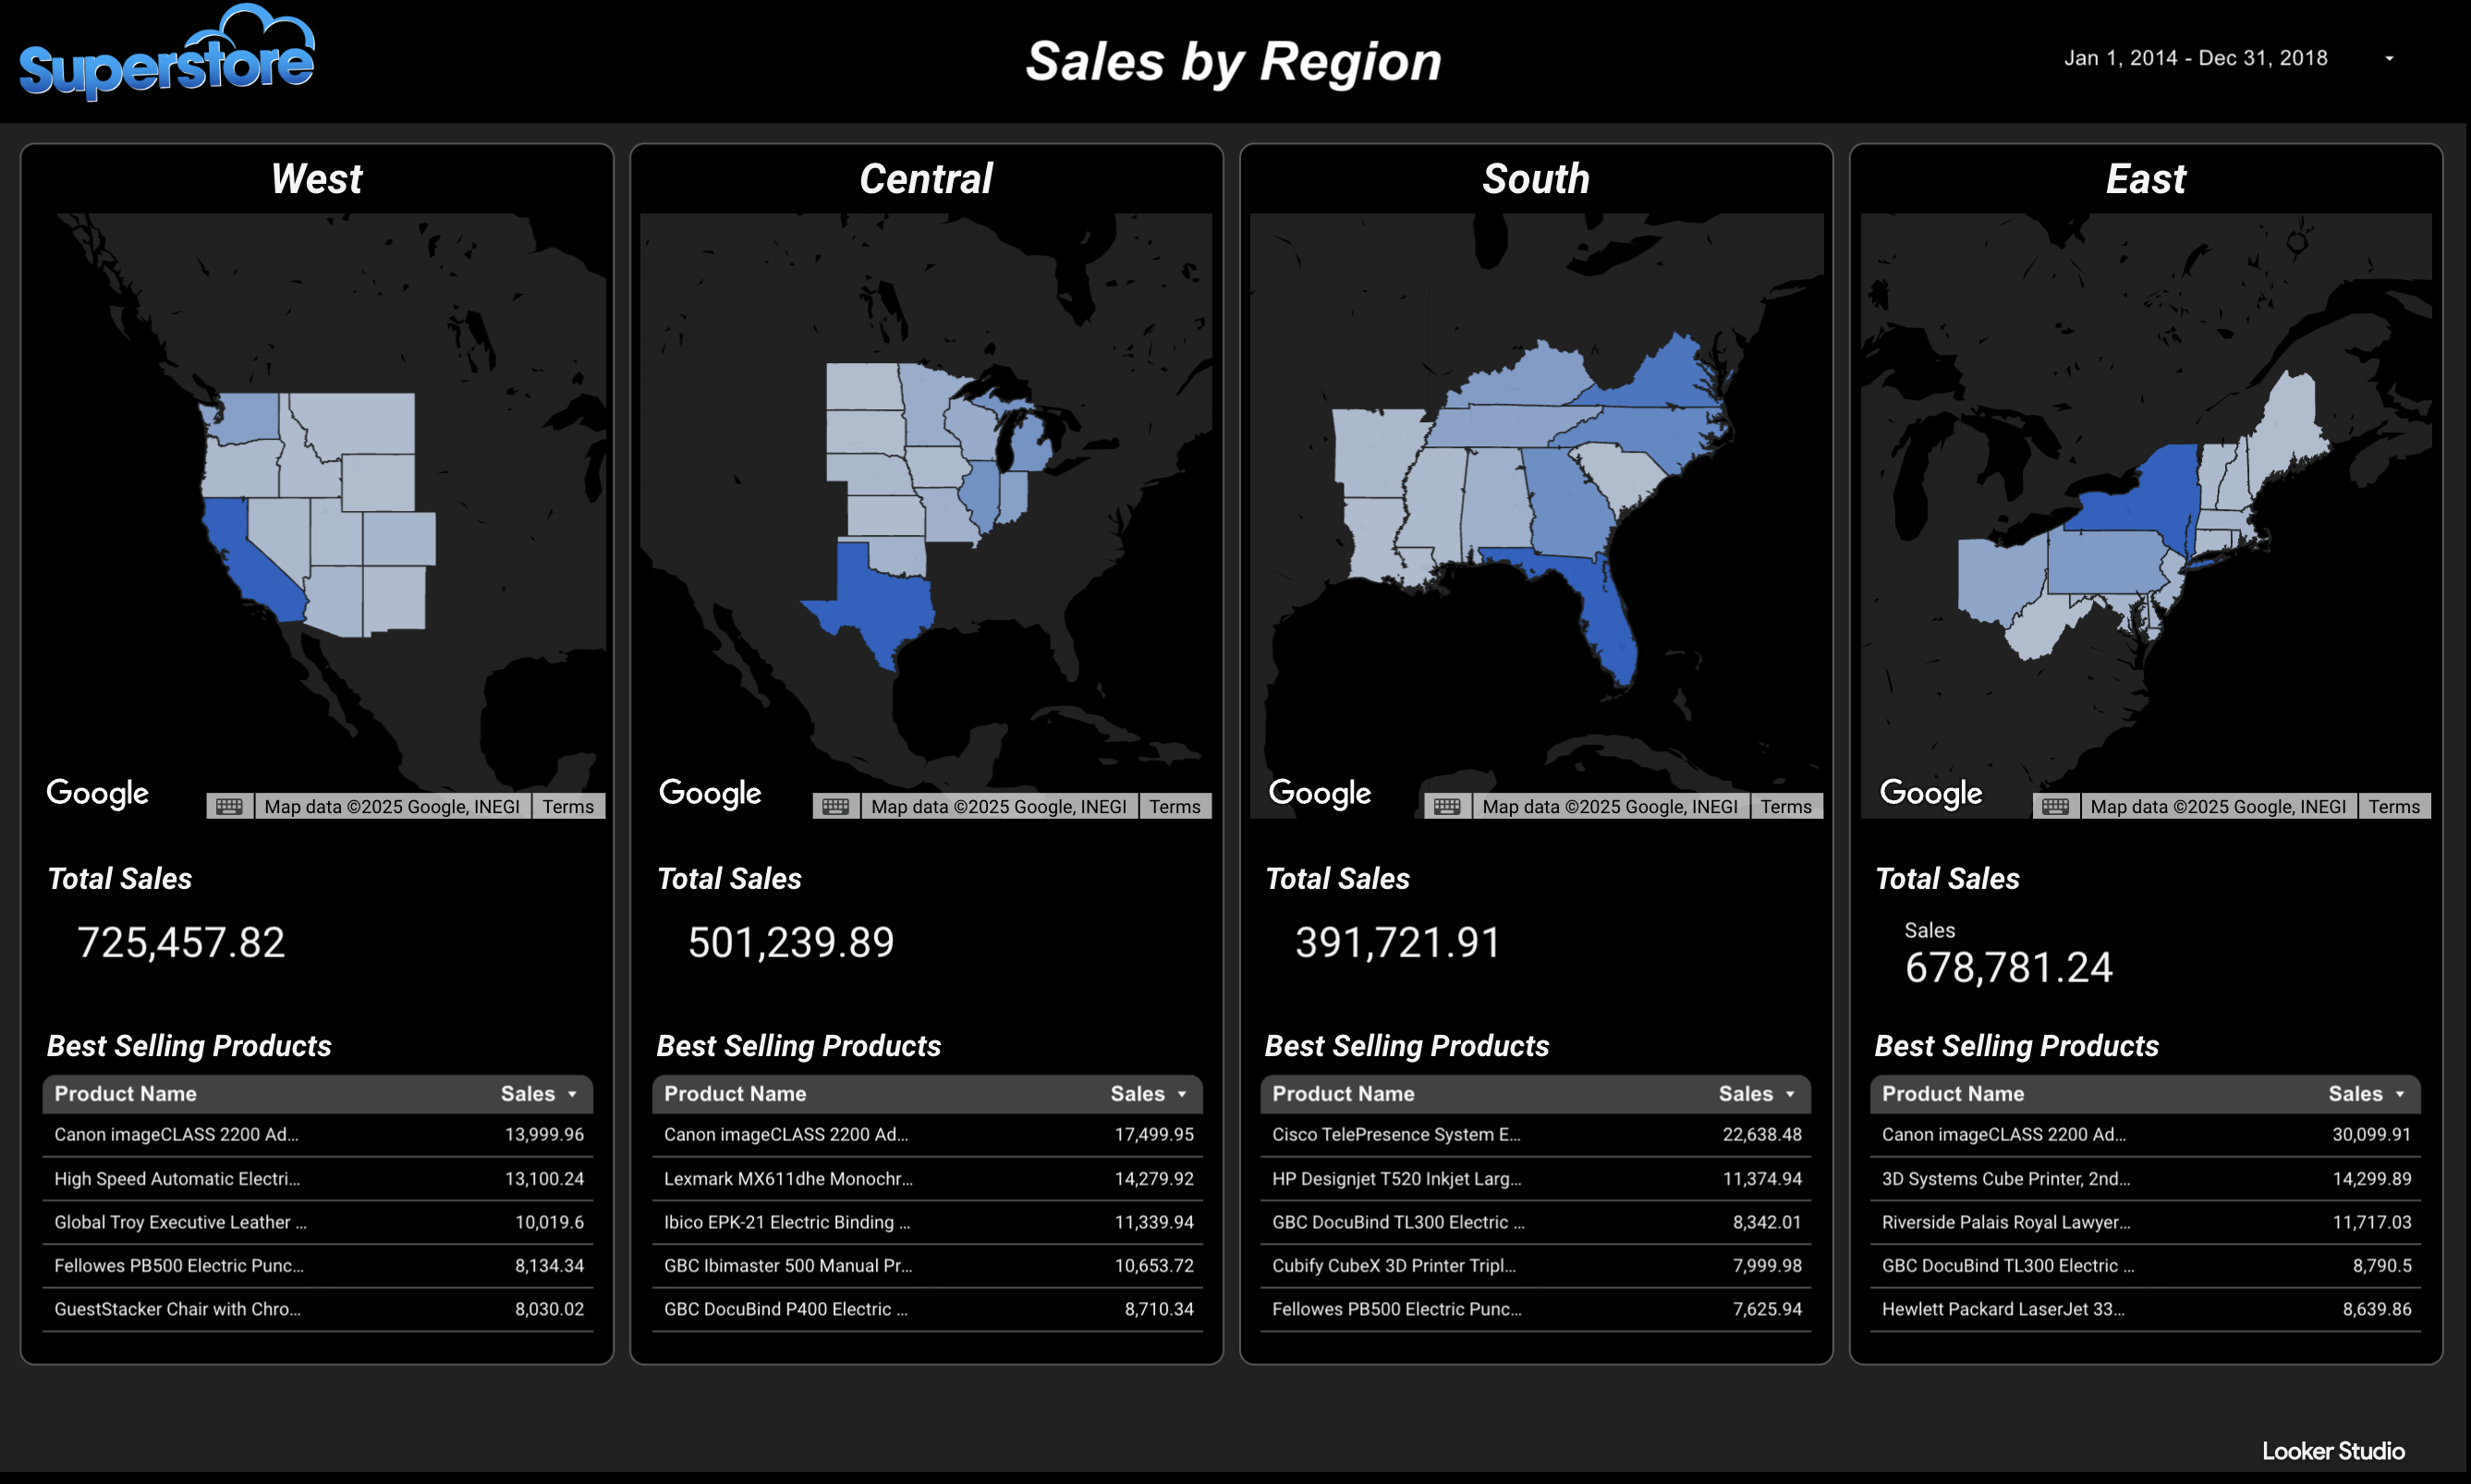
Superstore Dashboard
Interactive Looker Studio dashboard analyzing Superstore retail data with dynamic filtering, sales trends, and regional performance insights.
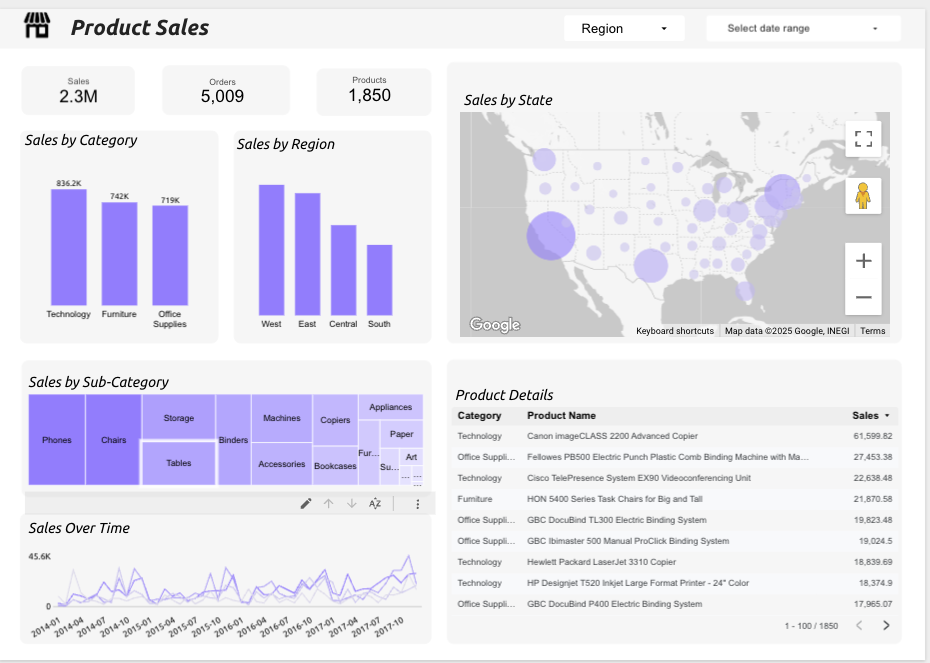
Product Sales Report
Interactive Looker Studio dashboard analyzing product sales performance with detailed metrics, trends, and insights across different product categories and time periods.

Earth's Warming Stripes
Interactive climate data visualization showing global temperature anomalies as warming stripes, illustrating climate change trends over time.

Musashi Character Map
Interactive character relationship visualization from Musashi novel, showing network connections and character interactions.

Spotify Discography Evolution
Dynamic visualization tracking artist discography evolution over time, analyzing musical trends and popularity patterns.
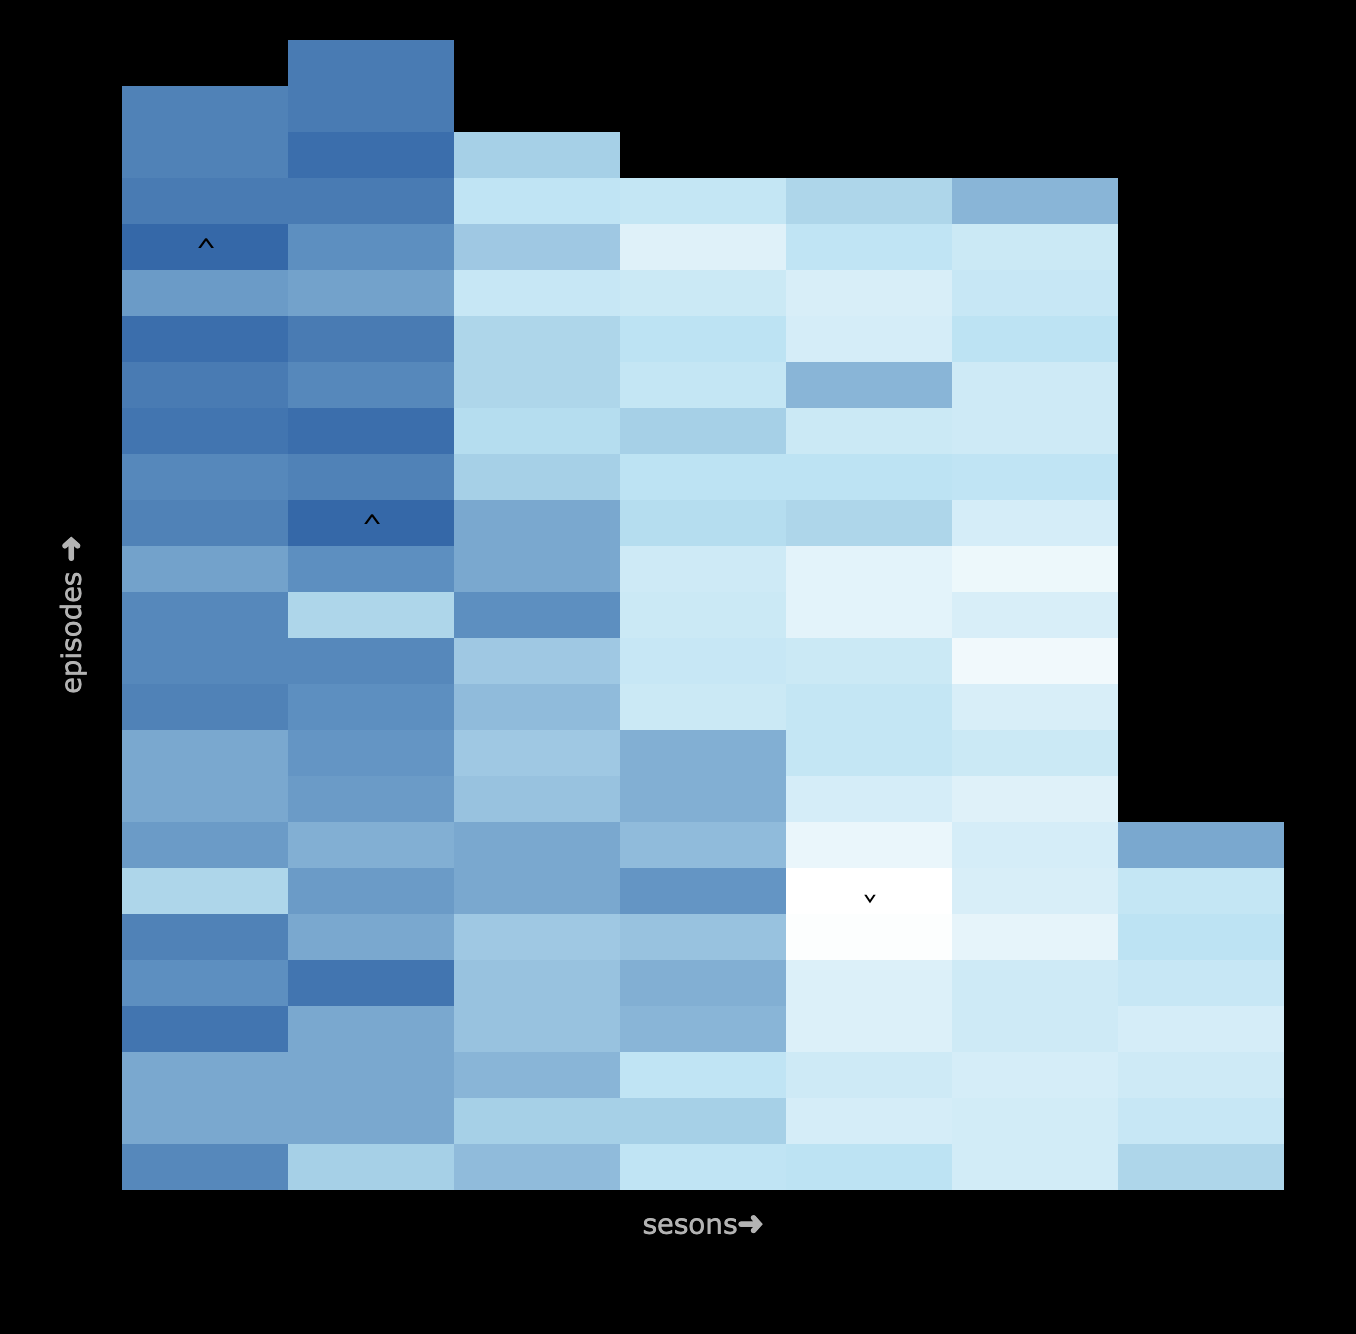
TV Show Heat Map
Interactive heat map visualization analyzing TV show ratings, viewership patterns, and temporal trends across different series.